Advanced Analytics for Sage Accounting
Advanced Analytics for Sage Accounting helps you to analyze your key financial metrics, such as accounts, expenses, invoices, and many such KPIs. With this connector, you can create insightful reports and dashboards on your financial data and thereby stay well ahead in your financial journey.
The Advanced Analytics for Sage Accounting includes 75+ prebuilt reports and dashboards over your Sage Accounting data that help you to jump-start your analytics right away.
General
- What is Zoho Analytics?
- Why Sage Accounting Analytics?
- Who can subscribe to the Zoho Analytics - Sage Accounting connector?
Pricing & Trial
- How much does this connector cost?
- Do you provide trial evaluation for this connector?
- What do you mean by 'Users' in the (connector) pricing plan?
- What do you mean by 'Rows'/'Records' and how is it calculated in the pricing plan?
Setup
- How do I setup the Sage Accounting Advanced Analytics connector?
- How long should I wait for my Sage Accounting data to initially appear in Zoho Analytics?
- What are the modules in Sage Accounting that will be synchronized in Zoho Analytics Workspace?
- I got this email which said 'Setup Process Failed'/'Synchronization Process Failed'. What should I do?
- How frequently can I synchronize my data with Zoho Analytics?
- Can I edit the Sage Accounting Synchronization setting?
- Can I view the data synced history?
- Can I synchronize my Sage Accounting data instantly?
- Can I setup the Sage Accounting Advanced Analytics in any other existing Workspace or in any other Advanced Analytics Workspace?
- Can I add/modify data in the Sage Accounting data tables within Zoho Analytics?
- Can I add new columns to the Sage Accounting data tables within Zoho Analytics?
- Can I add new data tables in this Sage Accounting to create reports & dashboards?
- Can I transfer my Zoho Analytics connector to another admin account?
- How do I re-authenticate my Sage Accounting account in Zoho Analytics?
- How can I remove the Integration?
Reporting Features
- In which modules of Sage Accounting can I create reports?
- How do I create my own reports with this connector?
- Can I create reports using the columns from different modules?
- What are the report types supported by Zoho Analytics?
- What are the default reports & dashboards created by Zoho Analytics, on setting up this connector?
- What are Formulas in Zoho Analytics?
- What are the default formulas that gets added by Zoho Analytics on setting up this connector?
- Can I create my own custom formulas in Zoho Analytics? If yes, how do I create?
- Can I combine/blend data from other sources with the data from Sage Accounting to create reports and dashboards?
- Can I create reports using columns from multiple tables?
- What are Query Tables?
Cross-Functional Analytics with Popular Business Applications/Other Data Sources
- What are the popular business applications/other data sources that I can integrate this connector with?
- How can I analyze the data from the third party business applications/other data sources along with Sage Accounting?
- Will a lookup relationship between the related modules from Sage Accounting and other third-party applications be created automatically?
Users, Sharing & Collaboration
- How do I share the reports in Zoho Analytics with my colleagues?
- What are the user roles available in Zoho Analytics?
- Why can't other users edit the reports that I have shared with them?
- Can I share the same report created, to multiple users with different criteria associated so that they see different data?
- Can I export a report/dashboard?
- How can I print the reports & dashboards created in Zoho Analytics?
- How can I email reports & dashboards created in Zoho Analytics in a scheduled manner?
- Can I embed/create a permalink for reports & dashboards created in Zoho Analytics?
Solutions
Help & Support
General
1. What is Zoho Analytics?
Zoho Analytics is a self-service BI and data analytics software that lets you analyze your data, create stunning data visualizations, and discover hidden insights in minutes.
Zoho Analytics offers the following important capabilities:
- Complete Online Business Intelligence and analytics service, accessible anytime, anywhere!
- Easy to adopt a 'spreadsheet-like' interface with powerful drag & drop based reporting features for quick report creation.
- Visual Analysis capability for in-depth analysis and to slice & dice your data.
- Wide range of reporting capabilities like Dashboards, Charts, Pivot Views, Summary Views, Tabular reports, and KPI widgets.
- Data import from various sources such as data stored in local drive (CSV, Excel, JSON, HTML, XML, JSON, Statistical & MS Access files), Web feeds and cloud storage. Also supports data import from local/hosted Databases and cloud databases. Supports periodic scheduling of importing data.
- Integrated with a suite of 15+ Zoho products such as Zoho CRM, Zoho Desk, Zoho Projects, Zoho People, Zoho Books, Zoho Billing, Zoho Inventory, Zoho Campaigns, etc.,
- Integrated with 45+ popular business applications like Xero, QuickBooks, Stripe, Shopify etc.,
- Integrated with Zapier and Zoho Flow to power up import from over 500+ apps.
- Integrates with custom applications using APIs.
- Easily blend/merge data from across different sources to create meaningful business reports and get end-to-end cross-functional analytics.
- Supports an advanced formula engine for deriving key business metrics from your data.
- Supports SQL (Structured Query Language) driven querying for powerful data preparation and report creation.
- Supports Data alerts to track vital changes in your key business metrics.
- Collaborative reporting and analytics with fine-grained permission control over your shared data and reports with your colleagues & friends.
- Efficiently collaborate with your users by setting up real-time commenting on a shared view.
- Publish reports for wider consumption. Embed reports/dashboards within your websites, web applications, and blogs.
- Email, Export, and Print reports in a variety of formats.
- Highly secure as all users login only over HTTPS (SSL connection). All your data and reports are hosted in secure data centers. (Refer to Security and Privacy)
- Supports Logo Rebranding.
- Get the mobile apps (optimized for both IOS and Android platform) and access the reports and dashboards on the go.
2. Why Sage Accounting Analytics?
Advanced Analytics for Sage Accounting helps you to analyze your key financial metrics and thereby helping you stay ahead in your financial journey. Analyze KPIs like account transactions, invoices, general ledger, and much more.
Advanced Analytics for Sage Accounting brings in all the capabilities of Zoho Analytics described in the above question.
- A full-featured business intelligence (BI) and reporting tool that can slice & dice the Sage Accounting data to create any reports/dashboards you require.
- Create your own reports and dashboards based on not only your Sage Accounting data but also by blending data from other data sources.
- Blend Data - Build cross-functional visualizations to extract end-to-end insights by combine\ing data from a wide range of business applications.
- Ask Zia - Workspace is Ask Zia trained and can answer your question in minutes.
- Share reports and dashboards with your colleagues.
- Set up Alerts to get notifications on key business metrics.
- Schedule and email your reports whenever you want.
- Export your reports as PDF, HTML, Excel, CSV and image files.
- Embed your reports on websites, blogs, etc.
3. Who can subscribe to the Zoho Analytics - Sage Accounting connector?
Users with paid accounts of both Zoho Analytics (at least the Basic plan) and Sage Accounting or Zoho CRM Plus / Zoho One users can avail this connector.
Pricing & Trial
1. How much does this connector cost?
Sage Accounting Analytics is bundled free for all the paid users of Zoho Analytics. The Zoho Analytics paid plans start at per month. Click to learn more about Zoho Analytics pricing page.
2. Do you provide trial evaluation for this connector?
Yes, we do provide a 15-day free trial for this connector from the date of set up.
3. What do you mean by 'Users' in the (connector) pricing plan?
Anyone to whom you privately share your Workspace, tables (data), reports and dashboards, created in Zoho Analytics, for collaboration is considered a 'User' in Zoho Analytics. A user is identified by his/her unique email address, with which their Zoho Analytics account was registered.
Suppose you subscribe to the Zoho Analytics Standard plan, you can privately share the data/reports in your account and collaborate with 4 other persons. Now your Zoho Analytics account is said to have 5 users (including yourself).
4. What do you mean by 'Rows'/'Records' and how is it calculated in the pricing plan?
In Zoho Analytics, a row or record is defined in the same context as in a database (or spreadsheet). In simple terms, a table consists of rows (records) and columns (fields). Each row in a table represents a set of related data and has the same structure.
For example, in a table that represents "Customers", each row would represent a single record. The number of rows calculated for pricing is the sum of all rows/records stored across all your Workspace tables in your Zoho Analytics account.
Setup
1. How do I setup the Sage Accounting Advanced Analytics connector?
2. How long should I wait for my Sage Accounting data to initially appear in Zoho Analytics?
Initial data import will take from a few minutes to a couple of hours depending on the volume of data in your Sage Accounting account. You will receive an email notification once the import is complete. If you access the Workspace before the initial fetch is complete, it will not display any data (empty tables i.e., tables with zero rows).
3. What are the modules in Sage Accounting that will be synchronized in Zoho Analytics Workspace?
You can synchronize the following data from Sage Accounting into Zoho Analytics.
- Bank Accounts
- Customers
- Ledger Accounts
- Ledger Entries
- Products
- Purchase Invoices
- Sales Invoices
- Services
- Stock Items
- Transactions
- Vendors
4. I got this email which said 'Setup Process Failed'/'Synchronization Process Failed'. What should I do?
The import/sync process of your Sage Accounting data can fail sometimes, due to a variety of reasons. Hence, you may receive such emails occasionally. The Zoho Analytics team will look into it immediately and get back to you, after taking the required corrective action.
Case 1: You will receive the Setup Process Failed mail when there is a failure during the initial fetch. In this case, we request you to:
- Open the Workspace in which you have set up the connector.
- Click the Data Sources button in the Explorer tab.
- In the Data Sources page that opens click the Retry Now link.
- If the issue persists please do write to support@zohoanalytics.com. We will look into it and get back to you immediately.
Case 2: You will receive the Synchronization Failed mail if there is any failure during the data synchronization process between Sage Accounting and Zoho Analytics, after the initial setup & import of data. This might be a momentary failure due to any internal issues. This import schedule will get suspended if there are five successive failures.
5. How frequently can I synchronize my data with Zoho Analytics?
You can choose to synchronize data at one of the intervals mentioned below.
- 1 Hour (Enterprise plan Only)
- 3 Hours
- 6 Hours
- 12 Hours
- Every day
Note:
- Users in Enterprise plan alone can choose to synchronize data at every 1 hour.
- Users in Basic plan can synchronize their data only once everyday.
6. Can I edit the Sage Accounting Synchronization setting?
Yes, you can edit the synchronization setting if you are the administrator who setup the connector. To do so,
- Open the corresponding Sage Accounting Advanced Analytics Workspace in Zoho Analytics.
- Click Data Sources on the left panel.
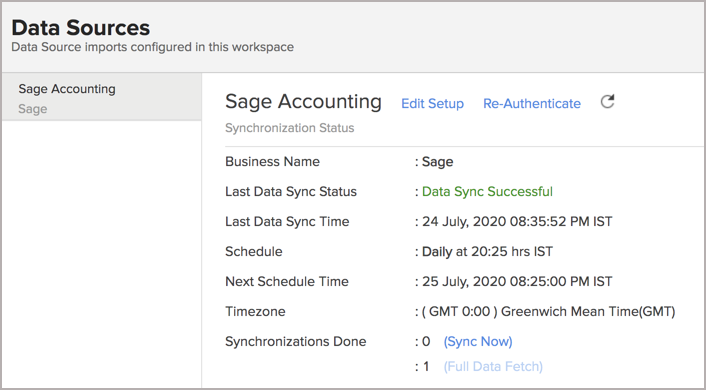
- In the Data Sources page that opens, click the Edit Setup link.
- The Edit Setup - Sage Accounting dialog will open. Modify the settings as needed.
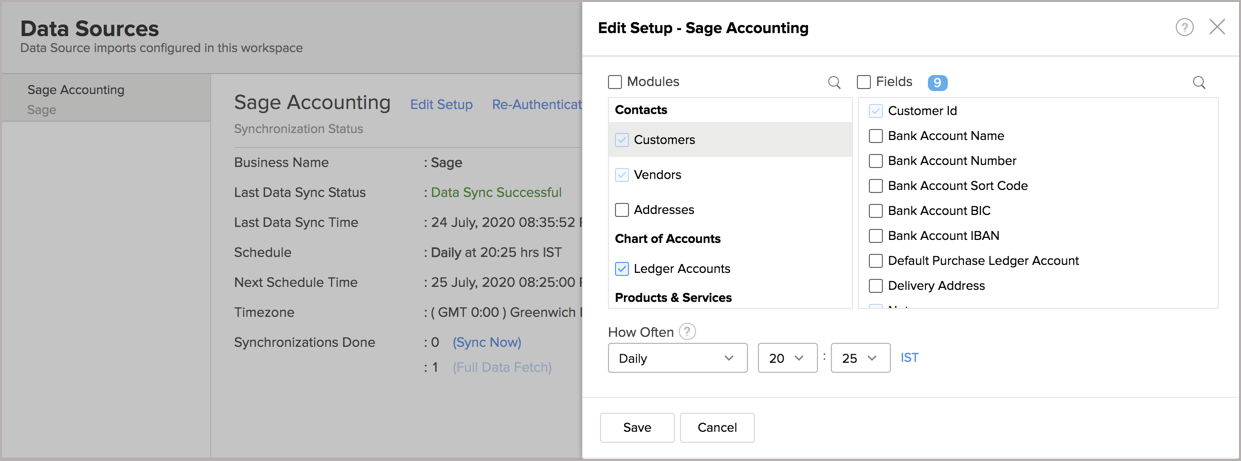
- Click Save. The synchronization setting will be modified and data will be synced in the next synchronization interval.


7. Can I view the data synced history?
Yes, you can view the data synced history. Follow the below steps to view the data synced history.
- Open the corresponding Sage Accounting Analytics Workspace in Zoho Analytics.
- Click Data Sources on the left panel. All the data source of the workspace will be listed.
- Click Sage Accounting. The Data Sources page for Sage Accounting will open.
- In the Data Sources page that opens, click the Sync History link.
- A calendar with the sync history of the last 45 days will open. The date when the data sync has happened will be highlighted. Hover to view the number of times the data had got synced on a specific date.
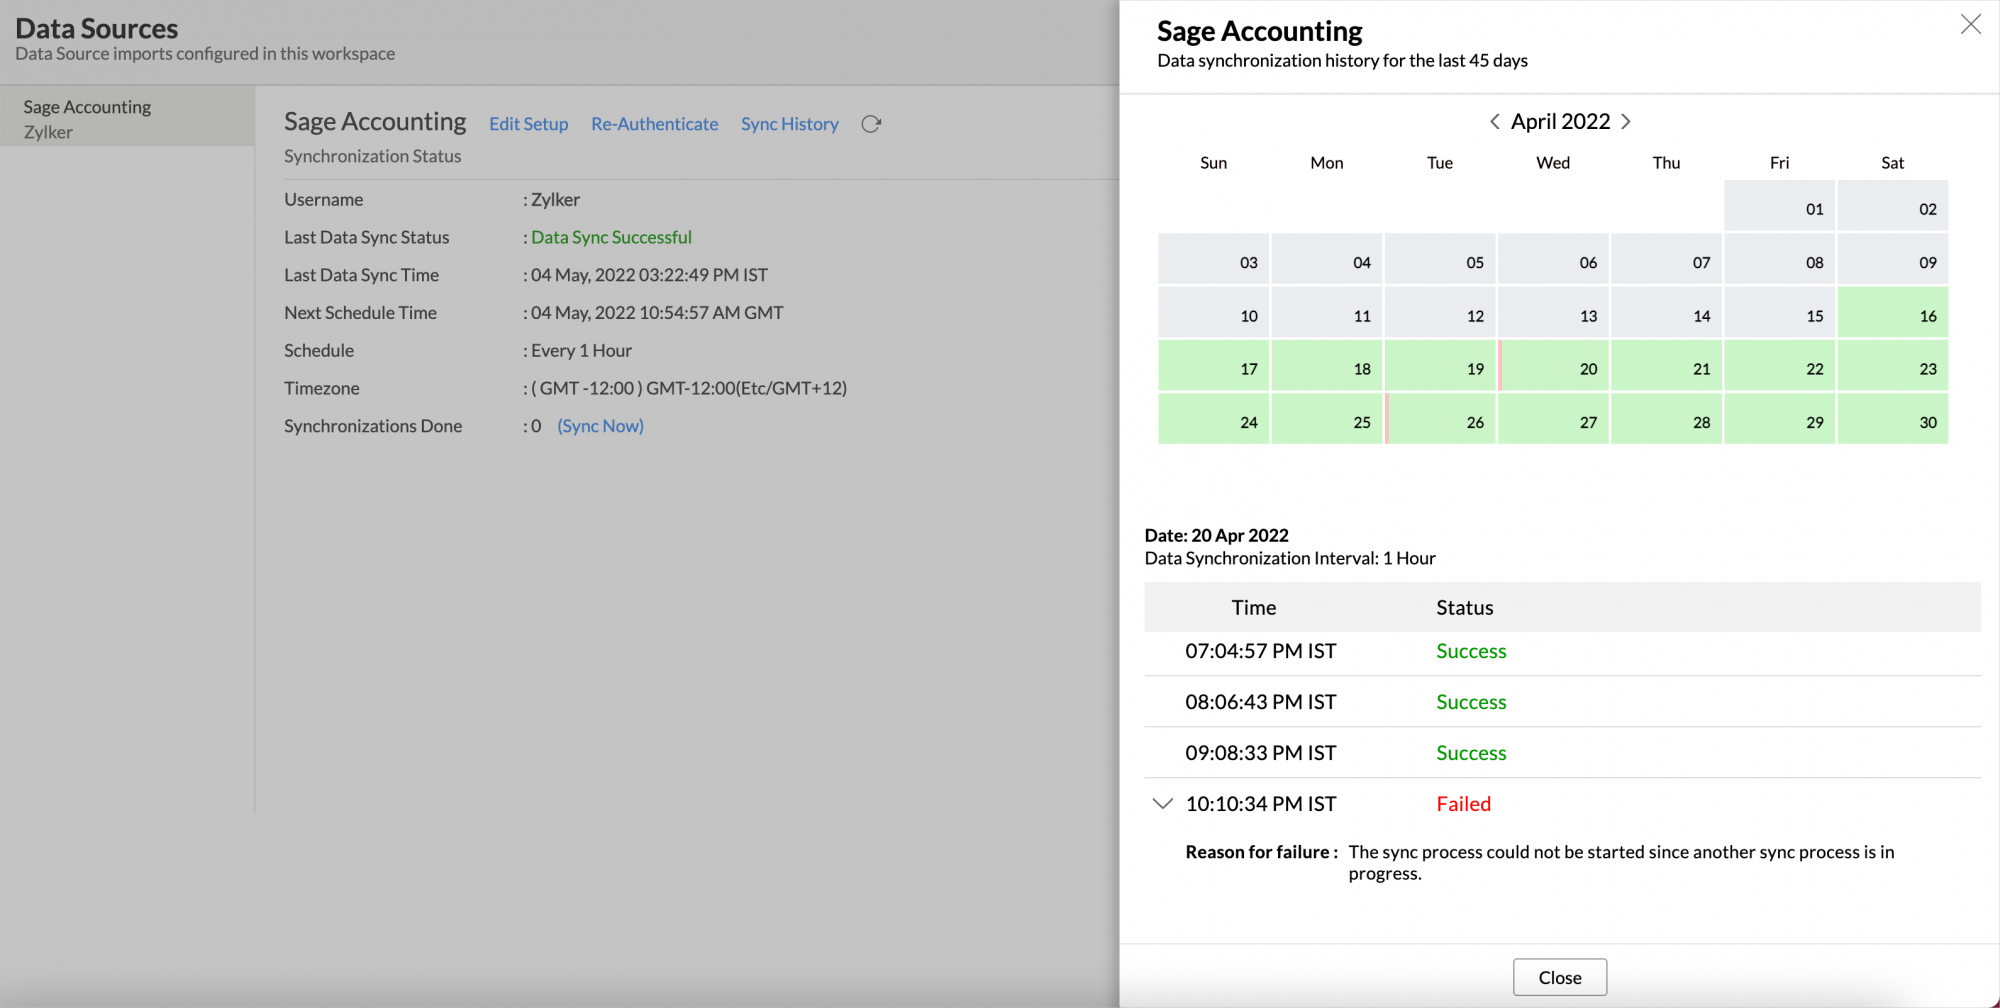
- Click the date to view more details.
- Time - Displays the time when the data is synced.
- Status - Shows whether the sync was a success or a failure.
In case of failure, the reason will be displayed. Refer to this page to learn how to resolve the issue and avoid further failure.

8. Can I synchronize my Sage Accounting data instantly?
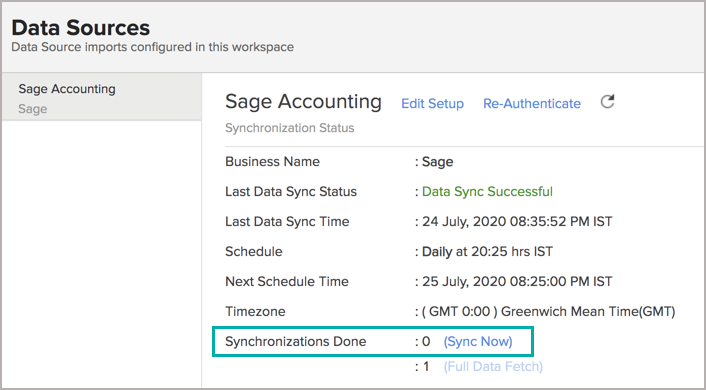
Yes, you can synchronize your Sage Accounting data instantly when needed.
To synchronize your data instantly:
- Open the corresponding Sage Accounting Advanced Analytics Workspace in Zoho Analytics.
- Click Data Sources on the left panel.
- Click Sync Now. Sage Accounting data will get instantly synchronized.

9. Can I setup the Sage Accounting Advanced Analytics in any other existing Workspace or in any other Advanced Analytics Workspace?
Yes, you can setup the Sage Accounting Advanced Analytics in any of the existing Workspace or in any of the Advanced Analytics Workspace to analyze data together. You can blend/combine data from Sage Accounting Advanced Analytics with the desired data. To know more about the same, refer to the Cross-Functional Analytics section.
10. Can I add/modify data in the Sage Accounting Analytics data tables within Zoho Analytics?
No, you cannot add/modify data in the Sage Accounting data tables. Data from the Sage Accounting application will automatically get synced into Zoho Analytics in the different tables. You cannot edit any of this data or add new data records from within Zoho Analytics.
However, you can add new tables and add/import data into that, to create reports combining it with the data from Sage Accounting.
11. Can I add new columns to the Sage Accounting data tables within Zoho Analytics?
No, you cannot add new columns. But, you can add Custom and Aggregate Formulas (i.e., calculated fields) to these tables to help you create powerful reports. Refer to Adding Formulas to know more about this.
12. Can I add new data tables in this Workspace to create reports & dashboards?
Yes, you can add new data tables. Click New > New Table to add a new table in the existing Sage Accounting Advanced Analytics Workspace.
With this feature, you can import data from other sources or add them manually into your Workspace to analyze and create reports combining this with your Sage Accounting data.
Refer:
- Import data from files
- Import data from Web feeds
- Import data from Cloud Storage
- Import data from local databases
- Import data from Cloud databases
- Import data from popular Business Applications
- Import data using Zoho Analytics API
13. How do I re-authenticate my Sage Accounting account in Zoho Analytics?
You can re-authenticate the setup by following the below steps.
- Open the corresponding Sage Accounting Advanced Analytics Workspace in Zoho Analytics.
- Click Data Sources on the left panel.
- Click Re-Authenticate.
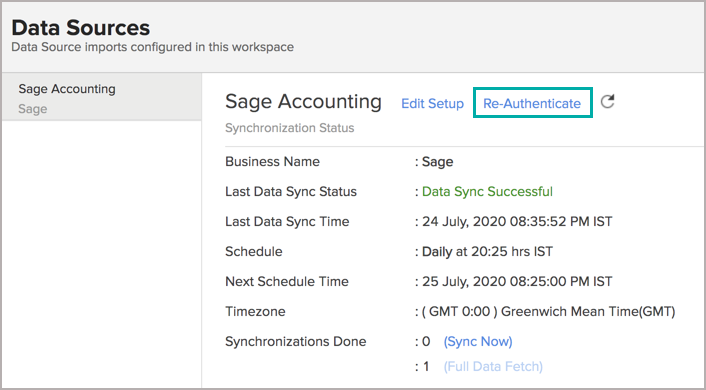

Your account will be successfully authenticated.
14. Can I transfer my Zoho Analytics connector to another admin account?
Yes, the Sage Accounting connector in your account, can be transferred to another Administrator in the Organization.
An Account Administrator can transfer the connector by transferring the account to an Organization Administrator. An Organization Administrator can transfer the connector setup to another Administrator by unsubscribing from the Organization.
15. How can I remove the Integration?
You can remove the connector from the Data Source page.
- Open the Sage Accounting Data Source page.
- Hover the mouse over the Data Source name in the left corner. A Settings icon will appear.
- Click the Settings icon.
- Select Remove Data Source.
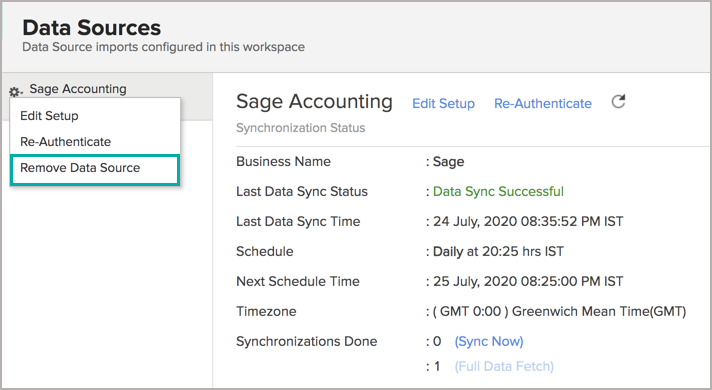

The data synchronization from Sage Accounting into this Workspace will be removed. However, you will still be able to access this Workspace with existing data.
Reporting Features
1. In which modules of Sage Accounting can I create reports?
Zoho Analytics will synchronize the data specified in this question into the Sage Accounting Analytics workspace. You can create reports using this data.
2. How do I create my own reports with this connector?
3. Can I create reports using the columns from different tables?
Yes, you can create reports using the columns from different tables. All the modules (tables) from Sage Accounting will be linked by default. You can create reports by simply dragging and dropping the required columns into the reports designer.
4. What are the report types supported by Zoho Analytics?
Zoho Analytics supports a wide variety of reports.
- Charts
- Pie
- Bubble
- Packed Bubble
- Bar
- Stacked bar
- Line
- Smooth Line
- Scatter
- Combination
- Map Chart
- Area
- Stacked Area
- Web
- Funnel
- Doughnut
- Table View
- Pivot tables (Matrix Views)
- Summary view
- Tabular view
- KPI Widgets
- Single Numeric Widget
- Dial Chart Widget
- Bullet Chart Widget
- Dashboards (multiple reports arranged in the same page)
5. What are the default reports & dashboards created by Zoho Analytics, on setting up this connector?
When you setup/configure the Sage Accounting Connector, 75+ default reports & dashboards are automatically created. These hand-picked reports will be pretty useful in analyzing your help data effectively.
6. What are Formulas in Zoho Analytics?
Formulas, as the name indicates, are calculations that help you derive key business metrics that can be used for reporting and analysis. Zoho Analytics provides a powerful formula engine to create any type of calculations required, to enable creating the required reports.
Refer to Adding Formulas in Zoho Analytics to know more.
7. What are the default formulas that gets added by Zoho Analytics on setting up this connector?
The default formulas added by Zoho Analytics are listed below. You can view these formulas by opening the corresponding table and selecting Add > Edit Formulas from the toolbar.
Note: The formulas provided is based on the general accounting standards.
The following are the formulas in the Sales Invoice table.
| Formula Name | Formula Type | Formula | Description |
| Sales without Tax | Aggregate Formula | Sum("Sales Invoices"."Base Currency Total Amount")-Sum("Sales Invoices Lines"."Tax Amount") | Displays the total sales amount excluding the tax amount |
| Cost of Sales | Aggregate Formula | Sum(If("Sales Invoices"."Status Id" not in ('DRAFT','PRO-FORMA','VOID') and "Sales Invoices Lines"."Product Id" is not null ,"Products"."Cost Price"*"Sales Invoices Lines"."Quantity",0)) | Displays the total cost of the goods sold |
| Sales value | Aggregate Formula | Sumif("Sales Invoices"."Status Id" not in ('DRAFT','PRO-FORMA','VOID'),"Sales Invoices Lines"."Base Currency Total Amount") | Displays the sales value |
| Projected Profit | Aggregate Formula | "Sales Invoices Lines"."Sales value"-"Sales Invoices Lines"."Cost of Sales" | Displays the estimated profit |
| Profit % | Aggregate Formula | "Sales Invoices Lines"."Projected Profit"*100/"Sales Invoices Lines"."Sales value" | Displays the percentage of Profit generated |
| Avg Sales Per Order | Aggregate Formula | "Sales Invoices Lines"."Sales value"/Countif("Sales Invoices"."Status Id" not in ('DRAFT','PRO-FORMA','VOID')) | Displays the average sales per order value |
| Avg Profit Per Order | Aggregate Formula | "Sales Invoices Lines"."Projected Profit"/Countif("Sales Invoices"."Status Id" not in ('DRAFT','PRO-FORMA','VOID')) | Displays the average profit per order |
| Median of Unit Price | Aggregate Formula | Percentile("Sales Invoices Lines"."Unit Price",50) | Displays the average of the sales in percentage |
| 90th Percentile of Unit Price | Aggregate Formula | Percentile("Sales Invoices Lines"."Unit Price",90) | Indicates value below which a given percentage of observation falls |
| Age in Days | Formula Column | datediff(now(), "Date") | Number of days since the sales invoice date |
| Age Tier | Formula Column | if( "Age in Days" >= 0, if( "Age in Days" <= 30, '1. 0 - 30 days', if( "Age in Days" <= 60, '2. 31 - 60 days', if( "Age in Days" <= 90, '3. 61 - 90 days', if( "Age in Days" <= 180, '4. 91 - 180 days','5. Above 180 days')))), '6. Negative - Not Valid') | Classifies the time spent on a invoice to close it, into different time period baskets, e.g., within 60 days, within 120 days etc., |
The following are the formulas in the Purchase Invoice table.
| Formula Name | Formula Type | Formula | Description |
| Total Outstanding Amount | Aggregate Formula | Sum("Purchase Invoices"."Outstanding Amount") | Displays the total outstanding to be paid |
| Paid Invoice Value | Aggregate Formula | Sumif("Purchase Invoices"."Status Id" = 'PAID',"Purchase Invoices"."Base Currency Total Amount") | Displays the paid amount in the invoice |
| Unpaid Invoice Value | Aggregate Formula | Countif("Purchase Invoices"."Status Id" = 'UNPAID') | Displays the remaining amount to be paid in the invoice |
| Average Purchase Value | Aggregate Formula | Sumif("Purchase Invoices"."Status Id" in ('PAID','UNPAID'),"Purchase Invoices"."Base Currency Total Amount")/Distinctcount("Purchase Invoices"."Purchase Invoice Id") | Displays the average value of each purchase |
| Paid Invoice Count | Aggregate Formula | Countif("Purchase Invoices"."Status Id" = 'PAID') | Displays the count of paid invoices |
| Unpaid Purchases Count | Aggregate Formula | Countif("Purchase Invoices"."Status Id" = 'UNPAID') | Displays the count of unpaid invoices |
| Median of Age in Days | Aggregate Formula | Percentile("Purchase Invoices"."Age in Days",50) | Displays the average or mean value of the number of days it takes for an Invoice to be closed |
| 90th Percentile in Age in Days | Aggregate Formula | Percentile("Purchase Invoices"."Age in Days",90) | Indicates a value below which a given percentage of observation falls |
| MTD Purchases Order Value | Aggregate Formula | mtd(Sum("Purchase Invoices"."Base Currency Total Amount"),"Purchase Invoices"."Date") | Displays the month to date purchase order value |
| YTD Purchase Order Count | Aggregate Formula | ytd(Count("Purchase Invoices"."Purchase Invoice Id"),"Purchase Invoices"."Date") | Displays the year to date purchase order count |
| Discount Percentage | Aggregate Formula | Sum("Purchase Invoices"."Payments Allocations Total Discount")/Sum("Purchase Invoices"."Base Currency Total Amount")*100 | Displays the discounted amount |
| Age in Days | Formula Column | datediff(now(), "Date") | Number of days since the purchase invoice date |
| Age Tier | Formula Column | if( "Age in Days" >= 0, if( "Age in Days" <= 30, '1. 0 - 30 days', if( "Age in Days" <= 60, '2. 31 - 60 days', if( "Age in Days" <= 90, '3. 61 - 90 days', if( "Age in Days" <= 180, '4. 91 - 180 days','5. Above 180 days')))), '6. Negative - Not Valid') | Classifies the time spent on a invoice to close it, into different time period baskets, e.g., within 60 months, within 120 days etc., |
The following are the default formulas in the Ledger Entries table.
| Formula Name | Formula Type | Formula | Description |
| Equity | Aggregate Formula | Sumif("Ledger Accounts"."Ledger Account Type" = 'EQUITY',"Ledger Entries"."Credit - Debit",0) | Displays the value of the shares issued by the company. |
| Cash Flow | Aggregate Formula | Sumif("Ledger Accounts"."Ledger Account Type" = 'BANK',"Ledger Entries"."Debit - Credit",0) | Displays the total amount of money being transferred into and out of a business, especially as affecting liquidity. |
| Cash Flow Margin | Aggregate Formula | "Ledger Entries"."Cash Flow"/"Ledger Entries"."Revenue" | The money a company generates from its core operations per dollar of sales |
| Debt To Equity | Aggregate Formula | "Ledger Entries"."Liability"/"Ledger Entries"."Equity" | A financial ratio indicating the relative proportion of shareholders' equity and debt used to finance a company's assets |
| Debt To Asset | Aggregate Formula | "Ledger Entries"."Liability"/"Ledger Entries"."Asset" | The proportion of a company's assets that are financed by debt |
| Current Ratio | Aggregate Formula | "Ledger Entries"."Current Asset"/"Ledger Entries"."Current Liabilities" | Displays company's ability to pay short-term and long-term obligations |
| Accounts Receivable | Aggregate Formula | Sumif("Ledger Accounts"."Control Name" = 'TRADE_DEBTORS',"Ledger Entries"."Debit - Credit",0) | It is the money owed to a company by its debtors |
| Cash Ratio | Aggregate Formula | ("Ledger Entries"."Cash and Equivalent")/"Ledger Entries"."Liability" | Displays the total cash available |
| EBIT | Aggregate Formula | "Ledger Entries"."Revenue"-"Ledger Entries"."Cost of Goods Sold"-"Ledger Entries"."Operating Expense" | Displays earnings before Interest and tax |
| Avg Accounts Receivable | Aggregate Formula | Avgif("Ledger Accounts"."Control Name" = 'TRADE_DEBTORS',"Ledger Entries"."Debit - Credit",NULL) | It is the money owed by customers to another entity in exchange for goods or services that have been delivered or used, but not yet paid for |
| Accounts Payable | Aggregate Formula | Sumif("Ledger Accounts"."Control Name" = 'TRADE_CREDITORS',"Ledger Entries"."Credit - Debit",0) | Displays the short-term debt that a company owes to its suppliers and creditors |
| Assets Turnover Ratio | Aggregate Formula | "Ledger Entries"."Cost of Goods Sold"/"Ledger Entries"."Asset" | Displays the assets turnover ratio |
| ROI | Aggregate Formula | (100*("Ledger Entries"."Revenue")/("Ledger Entries"."Assets") | ROI measures the amount of return on an investment relative to the investment’s cost |
| EBIT Margin | Aggregate Formula | "Ledger Entries"."EBIT"*100/"Ledger Entries"."Revenue" | EBIT Margin is the ratio of Earnings before Interest and Taxes to net revenue earned. |
| Balance | Aggregate Formula | Sum("Ledger Entries"."Debit")-Sum("Ledger Entries"."Credit") | Displays the balance in the account |
| Revenue | Aggregate Formula | Sumif("Ledger Accounts"."Ledger Account Group Id" in ('INCOME'),"Ledger Entries"."Credit - Debit") | Displays the revenue generated |
| Expense | Aggregate Formula | Sumif("Ledger Accounts"."Ledger Account Group Id" = 'EXPENSE',"Ledger Entries"."Debit - Credit") | Displays the expenses incurred |
| Profit | Aggregate Formula | "Ledger Entries"."Revenue"-"Ledger Entries"."Expense" | Displays the total profit |
| Gross Profit Margin | Aggregate Formula | "Ledger Entries"."Profit"*100/"Ledger Entries"."Revenue" | Displays the profit margin. ie. the amount by which revenue from sales exceeds costs in a business. |
| Operating Expense | Aggregate Formula | Sumif("Ledger Accounts"."Ledger Account Type" = 'DIRECT_EXPENSES',"Ledger Entries"."Debit - Credit") | Displays the Total Expenses minus Cost of goods sold |
| Operating Income | Aggregate Formula | "Ledger Entries"."Revenue"-"Ledger Entries"."Operating Expense" | Displays the earnings before interest and taxes |
| Operating Profit Margin | Aggregate Formula | "Ledger Entries"."Operating Income"*100/"Ledger Entries"."Revenue" | Provides the company's profit margin in percentage |
| Expense To Revenue Ratio | Aggregate Formula | "Ledger Entries"."Expense"/"Ledger Entries"."Revenue" | Displays the company's operating expenses divided by its revenues. |
| Asset | Aggregate Formula | Sumif("Ledger Accounts"."Ledger Account Group Id" = 'ASSET',"Ledger Entries"."Debit - Credit",0) | It is an item of property owned by the company with the mortgage value |
| Liability | Aggregate Formula | Sumif("Ledger Accounts"."Ledger Account Group Id" in ('LIABILITY'),"Ledger Entries"."Credit - Debit",0) | Displays company's legal debt or obligation |
| Cost of Goods Sold | Aggregate Formula | Sumif("Ledger Accounts"."Ledger Account Type" = 'DIRECT_EXPENSES',"Ledger Entries"."Debit - Credit",0) | The direct costs attributable to the production of the goods sold by a company |
| Cash and Equivalent | Aggregate Formula | Sumif("Ledger Accounts"."Ledger Account Type" = 'BANK',"Ledger Entries"."Debit - Credit",0) | Displays the total cash available |
| Current Asset | Aggregate Formula | Sumif("Ledger Accounts"."Ledger Account Type" in ('CURRENT_ASSETS'),"Ledger Entries"."Debit - Credit",0) | It is an item of property owned by the company with the mortgage value |
| Current Liabilities | Aggregate Formula | Sumif("Ledger Accounts"."Ledger Account Type" in ('CURRENT_LIABILITY'),"Ledger Entries"."Credit - Debit",0) | Displays company's legal debt or obligation |
| Quick Ratio | Aggregate Formula | ("Ledger Entries"."Cash and Equivalent"+"Ledger Entries"."Accounts Receivable")/"Ledger Entries"."Current Liabilities" | It is the measure of how well a company can meet its short-term financial liabilities |
| Balance Sheet Total | Aggregate Formula | Sumif("Ledger Accounts"."Ledger Account Group Id" in ('ASSET','EXPENSE'),"Ledger Entries"."Debit - Credit","Ledger Entries"."Credit - Debit") | Displays the company's financial position at a given date |
| Profit and Loss Balance | Aggregate Formula | Sumif("Ledger Accounts"."Ledger Account Group Id" in ('INCOME'),"Ledger Entries"."Credit - Debit",0)-Sumif("Ledger Accounts"."Ledger Account Group Id" in ('EXPENSE'),"Ledger Entries"."Debit - Credit",0) | Displays the company's financial statement in terms of profit or loss |
| YTD Balance Sheet Total | Aggregate Formula | ytd("Ledger Entries"."Balance Sheet Total","Ledger Entries"."Date") | Displays the year to date balance sheet total |
8. Can I create my own custom formulas in Zoho Analytics? If yes, how do I create?
Yes, you can create your own custom formulas in Zoho Analytics. To know how to create your own formulas, refer to the Adding Formulas in Zoho Analytics help page.
9. Can I combine/blend data from other sources with the data from Sage Accounting to create reports and dashboards?
Yes, you can combine data from your other sources with your Sage Accounting data for analysis.
To do this, you need to add/import a new data table into the Sage Accounting Advanced Analytics Workspace as explained in the previous question and then define a look-up to join it with the table from Sage Accounting.
To define a lookup relationship between two tables, it is essential that the tables have at least one column which is common between them. Follow the below steps to look up a column from Sage Accounting along with the data from any other source.
- Open the corresponding table, right-click the column header and select Change to Lookup Column.
- In the Change to Lookup Column dialog that opens, select the column to look up.
- Click OK.
10. Can I create reports using columns from multiple tables?
Yes, you can create reports using columns from multiple tables. Refer to Joining Tables in Zoho Analytics for detailed help on this.
11. What are Query Tables?
Zoho Analytics allows you to drive the data required by writing standard SQL SELECT Queries. This feature is called Query Tables. With Query Tables, you can also combine data from different tables and create reports from the same. Click here to know how to create Query Tables in Zoho Analytics.
Cross-Functional Analytics with Popular Business Applications/Other Data Sources
1. What are the popular business applications/other data sources that I can integrate this connector with?
You can integrate and perform cross-functional analytics with most business applications/other data sources that Zoho Analytics integrates with.
2. How can I analyze the data from the third party business applications/other data sources along with Sage Accounting?
To import data from business apps,
- Open the Workspace in which you have setup the connector.
- Click the Import Data button.
- In the Create New Table tab that opens, select the application or data source that you wish to import.
- Provide the necessary authentication.
- Select the necessary modules and fields.
- Select the schedule import option.
- Click Create. Data from the selected application will be imported into a new table in the Sage Accounting Advanced Analytics workspace.
3. Will a lookup relationship between the related modules from Sage Accounting and other third-party applications be created automatically?
The automatic lookup relation is not available for this connector. However, you can manually create lookup relationships.
To manually create a lookup relationship, refer to this help link - https://www.zoho.com/analytics/help/table/joining-tables.html.
Users, Sharing & Collaboration
1. How do I share the reports in Zoho Analytics with my colleagues?
You can easily share the reports that you create with the other users in your organization. Refer to Sharing and Collaboration help page for more details on this.
Once you privately share a report to your colleagues they will be able to access the reports as you do. Refer here to know how to access the reports.
2. What are the user roles available in Zoho Analytics?
Zoho Analytics offers four user roles - Account Administrator, Organization Administrator, Workspace Administrator, and User. Click to know more about the Zoho Analytics Organization Model and User Roles.
3. Why can't other users edit the reports that I have shared with them?
This is the expected behavior. Only when the users to whom the reports are being shared is set as a Workspace Administrator, they will be able to edit the reports. If a normal user wants to edit the report, he/she will have to save the report with a new name using the Save As option toolbar. The User can edit this report. To know more about user roles click here.
4. Can I share the same report created, to multiple users with different criteria associated so that they see different data?
Yes, you can. Refer to the topic Apply filter criteria.
5. Can I export a report/dashboard?
Yes, you can export the report/dashboard in various file formats such as CSV, EXCEL, PDF, HTML, and Image. Click to know more.
6. How can I print the reports & dashboards created in Zoho Analytics?
To print the report/dashboard, you first need to export it. You can export the report in various file formats such as CSV, EXCEL, PDF, HTML, and Image. Click to know more.
If you are a user to whom a report has been shared and you want to take a print, ensure you have been provided the Export permission by the Administrator to the report, only then you will be able to print the report.
7. How can I email reports & dashboards created in Zoho Analytics in a scheduled manner?
If you are the Administrator of the Zoho Analytics or a 'Workspace Administrator', you can schedule reports and dashboards to be emailed automatically. Refer to the email schedule section in this help documentation.
8. Can I embed/create permalink for reports & dashboards created in Zoho Analytics?
Yes, you can embed/create permalink for reports & dashboards. You can also create a slideshow of views. Refer to the Publishing Option section to learn how to do this.
Solutions
1. Does Zoho Analytics offer Embedded Analytics or rebranding?
Yes, Zoho Analytics supports various rebranding options such as Portal rebranding/white labeling and Logo Rebranding.
Read about the various pricing plans that we offer from the Pricing section.
Help & Support
1. How do I get technical support on Zoho Analytics?
We offer 24x5 technical support (Monday to Friday). In case if you need our assistance kindly do mail us your questions to support@zohoanalytics.com.
You can also reach out to us on our toll-free numbers.
United States: +1 (888) 900 9646
United Kingdom: +44 (20) 35647890
Australia: +61-2-80662898
India: +91-44-67447000
2. Can I have someone from Zoho do a demo for me?
Yes, certainly. Register for a demo in this page.